
Retail Product Page
Optimization for Production Scale
Concept
Coming from a background in hardware, scalability is one of the things that most excites me in software engineering but while code can be easier to ship than physical products, fortifying a website for viral traffic is a challenge of application design, system design, testing and observation.
In this project, I worked with a small team to extend the server-side infrastructure of components on an existing retail site. The goal was to increase the number of products listed on the site from 100 to 10 million and to identify and develop strategies for resolving bottlenecks produced when handling hundreds of client requests per second. My focus was on the page’s product reviews component.
For more information, keep reading on or visit this project on Github.
Implementation
Generating Mock Data
Beginning with a plan to compare the performance of several databases, I decided to generate a single mock dataset of product reviews saved across several TSV files and then populate each database using its native import tool.
Node.js is particularly well suited for this task and helped resolve three challenges in generating the 70 million product reviews for 10 million products. First was the challenge of generating realistic mock data: I wrote a collection of helper functions to generate each datapoint using the library casual and another function bringing these all together to generate a single mock review. Next, generating millions of data points has the potential to overwhelm available memory. To overcome the barrier of Node's heap limit, the file system module's fs.createWriteStream method provides a way to save data to disk as it’s generated at a pace the operating system can handle. Finally, Node’s Child Process tools allow for system scripting including spawning multiple process to run in parallel and orchestrating a series of asynchronous events. In the case of this project, I initially used child processes to generate multiple TSV files in parallel on a local machine with multiple CPU cores. Later, on a deployed server with limited disk space I opted to create, load and delete each TSV in sequence to reduce the amount of surplus disk space required for the project.
Comparing Databases
With a dataset of 70M entries generated for the project, the next objective was to survey a range of popular database management systems including PostgreSQL, MongoDB and Cassandra and select a database to use for the project.
Loading data into each DBMS was the first opportunity to compare performance and I used the UNIX time utility to find that while PostgreSQL and MongoDB were able to load the all the data in 10min and 23min respectively, Cassandra was almost 10 times slower taking 28min to load only 10M of 70M total records. Despite the appeal of Cassandra's distributed architecture, the load time was prohibitively slow for this project.
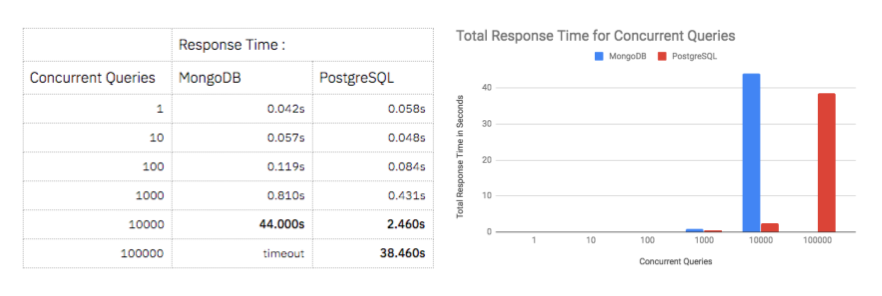
Moving forward with PostgreSQL and MongoDB I looked to compare the main performance characteristic of each database for the scope of this project: the time for to find reviews associated with each product. After indexing both databases based on product id numbers, I wrote benchmarking scripts using Promise.all() and Node.js's process.hrtime() to execute concurrent queries to random product numbers measure the time for all queries to return. This comparison showed that both databases performed comparably and in the millisecond range when handling less than 1000 queries but that PostgreSQL could handle 10,000 concurrent queries in 2.46s while MongoDB struggled to return the same number in 44s. Based on this disparity I decided to continue with PostgreSQL and I adjusted my application's API server to communicate with a new AWS EC2 server instance hosting the database.
Load Testing
To begin load testing, I containerized and deployed my server application to an AWS EC2 instance using Docker. There are many load testing tools including artillery, jmeter, ApacheBench and siege - each offers ways to simulate real user traffic including making requests to a specific endpoint, a randomized range of API endpoints or making requests based on references in an HTML page the way a browser does.
Ultimately, it is challenging to load test locally with any of these tools because the machine is taxed by both requesting and serving a high volume of traffic. The service Loader.io resolves this by using a network of their own computers to direct HTTP requests to your deployed server. Using Loader requires creating a verification endpoint on your server to echo back a string based on the server's IP address - this is to prevent their tool from being used for DDOS attacks. Additionally, it's important to choose appropriate endpoints to stress test the server. For each page visit, users will require a set of static files and one API request from the server. I settled on two different types of requests to represent user traffic:
- A request for the largest static a user would need:
bundle.js, a React application bundled with Webpack - Requests to the RESTful API endpoint which query the database and return JSON representing reviews on a page
Serving Static files
One of the first bottlenecks observed from load testing was that the API server could handle 250 requests per second but the static server faltered at this rate. I looked at two approaches to improving this performance:
Using Nginx as a Dedicated Static Server
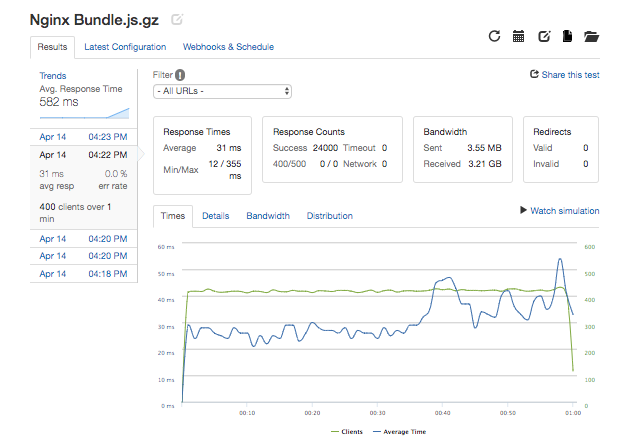
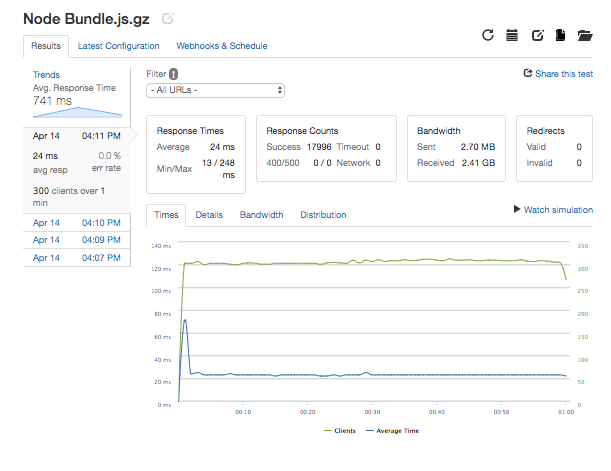
- Although Node.js is great for implementing logic and making database queries, other servers like Nginx have significant marketshare and are potentially more optimized for serving static files. I used Docker to deploy an Nginx server on another AWS EC2 t2.micro instance and compare its performance. I found that Nginx outperformed my Node.js server but not by much, topping out around 400 requests per second compared to 300RPS with Node. In both cases, when stress testing I found that operating system resources like CPU, memory and open file limits were reached suggesting that vertically scaling to a larger server instance or horizontally scaling across multiple servers would be needed to handle more traffic.
Reducing the amount of data served through build tools and dependency pruning
- If serving large files is expensive, a performance boost can be found by reducing the amount of data served as much as possible.
- I used Webpack and associated plugins to automate the minifcation and compression of static files for this project. Additionally, from looking at reports generated by the Webpack Bundle Analyzer I was able to reduce the size of my
bundle.jsfile from 641KB to 144KB by identifying thatmoment.jswas being bundled as a dependency though it was ultimately not needed in the project.
Load Balancing
To further modularize the project architecture and expand beyond the traffic a single web server can handle, load balancers can help horizontally scale resources across multiple servers, create redundancy for site reliability and cache commonly used data closer to the user for quick retrieval. For this project I compared the performance of HAproxy and Nginx but finding their performance as reverse proxy servers to be similar, I opted to use Nginx and take advantage of its caching options which gave a significant performance boost.


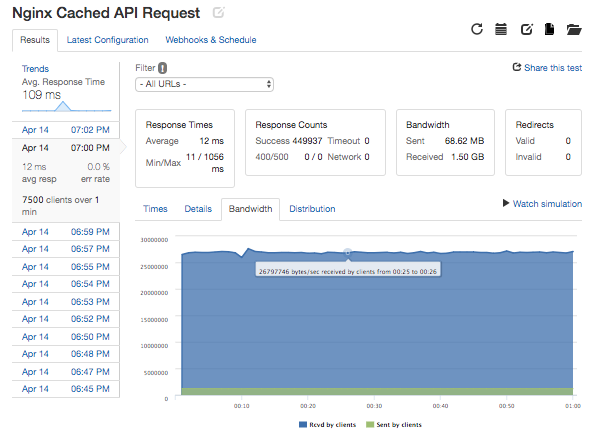
Caching
Caching allow us to take advantage of the expectation that some resources on a site are likely to be significantly more popular than others. Once configured in nginx.conf, the Nginx cache operates like a hash table where data is stored and retrieved from disk based on the URL endpoint it is associated with. Data is stored based on HTTP cache headers and pruned when there is no more available disk space based on policies such as removing the least recently used data.
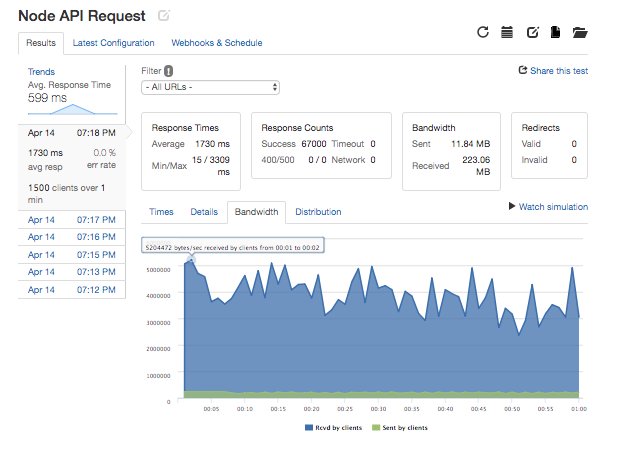
If the most popular data is stored at the load balancer, common requests can be fulfilled quicker and the web or database server instances can be left to handle less common requests when they occur. The benefits of caching are bounded by the load balancer's ability to handle requests and by available memory and disk space but I found that when bombarding my service's API with requests for a limited range of 1000 out of 10M endpoints, I was able to achieve dramatically greater bandwidth at 1.50GB per minute with a caching load balancer compared to 223 MB per minute making requests directly to a Node.js server.
Observability
As a final point about designing a scalable service, it is important to note the challenge and benefits of observing key data points to identify bottlenecks, ensure resources are neither being used efficiently and track performance increases as changes are made to the system.
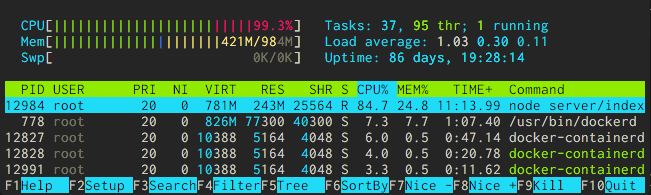
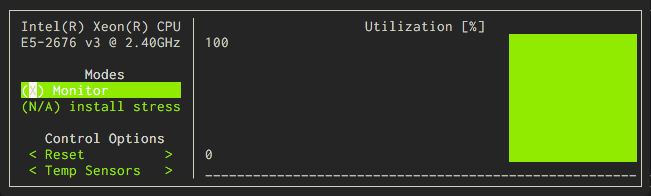
In this project I relied on two Unix utilities to monitor performance on the operating system level: htop which provides a colorful CPU and Memory usage meter along with a sortable list of processes and their resource use and s-tui which graphs CPU usage and other vital stats over time.
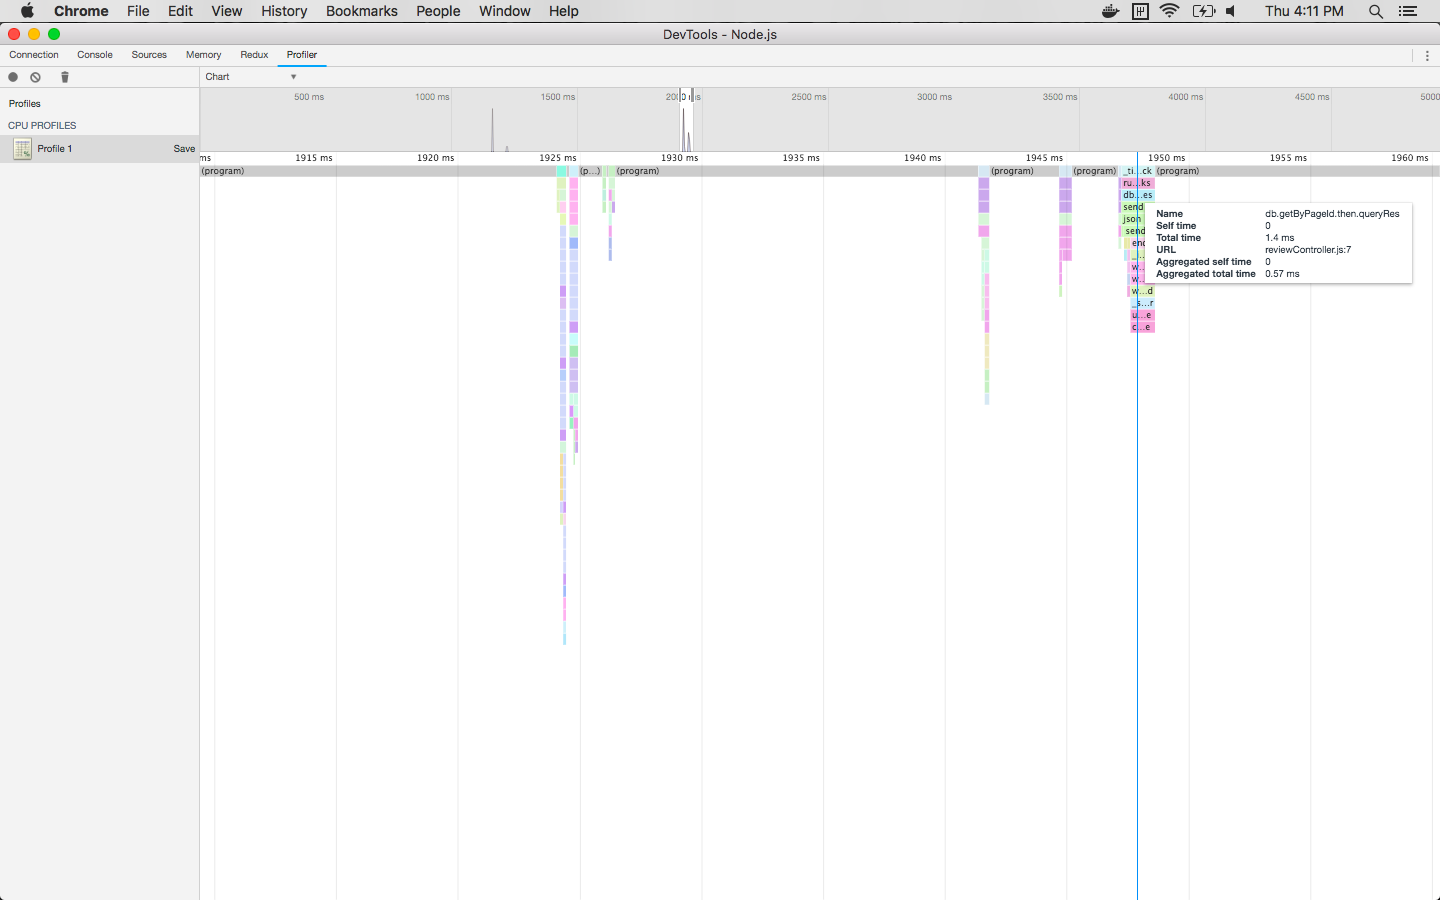
To probe the performance of a Node.js based application, Node can be run with the Google Chrome debugger and flame graphs can be made to visualize the call stack produced by user's visit using the Profiler tab.
Finally, although terminal utilities and the Node debugger allow for fairly granular measurement, at a higher level, it can be difficult to visualize the performance of multiple server instances and answer the question: should we dive in and refactor some code or just spin up a new server instance? In that case, services like Datadog and New Relic with integrations at the OS or application level are invaluable for tracking the performance of a larger distributed system.